




XLM jumps from $0.14 to $0.22 after short liquidations near $10M, with traders tracking $0.24 and $0.25 resistance zones.
XLM moved sharply from the $0.14 zone to near $0.22 after several flat sessions, as traders tracked a rapid sweep of leveraged short positions.
The move placed Stellar back into a key resistance area, while market data shared by traders pointed to fresh liquidation pressure near $0.24 and $0.25.
XLM Breaks Out After Six-Day Base
Stellar traded near $0.14 for about six days before the sharp move higher. The price then climbed toward $0.22 within 48 hours, based on the chart data.
The breakout followed a long period of weak price action. XLM had been moving inside a lower range after a broader decline from earlier highs.
that XLM heatmap just told me everything 👀
flatlined at 0.14 for 6 days… then exploded to 0.22 in 48 hours
371M in liquidation leverage sitting at 0.18 got swept clean now the next wall is 0.24 and price is stair-stepping straight toward it short squeeze staircase is still… https://t.co/Rbs99FVp0p pic.twitter.com/sSTnZam2sK
— 𝗕𝗮𝗻𝗸XRP (@BankXRP) May 29, 2026
The daily chart shows price lifting from the $0.145 to $0.160 demand area. This zone had acted as support before the sudden rally.
XLM was trading near $0.2178 on the chart, with a daily gain of about 7%. The move pushed price back toward a prior congestion zone.
Liquidation Leverage Gets Swept
Traders pointed to a large cluster of liquidation leverage around $0.18. The level was swept as price moved higher through the short-term range.
The reported leverage cluster near $0.18 was valued at about $371 million. The move through that level may have forced short traders to close positions.
Short liquidations also rose during the two-day rally. Market commentary noted that short wipeouts nearly reached $10 million over that period.
Over the past two days, Stellar XLM has seen its largest liquidations as short wipeouts nearly reached $10Million.
A move up past .25cents will wipe out a whole new batch.✅ https://t.co/ZfPXJfDIay pic.twitter.com/JsVPKjGOkY
— Chad Steingraber (@ChadSteingraber) May 29, 2026
Liquidation events can add fuel to a rising market. Short sellers may buy back positions when price moves against them.
This buying can create a squeeze pattern. In this case, traders described the move as a “short squeeze staircase.”
The next watched liquidation zone is near $0.24. A move above $0.25 could clear another group of leveraged positions, according to the shared market view.
Read Also:
Stellar Leads Developer Growth As XLM Ecosystem Surges To 4,400 Builders
Price Tests Key Resistance Near $0.24
The $0.22 to $0.25 area is now the main resistance zone on the daily chart. Price is already trading near the lower end of that range.
A daily close above this area would show stronger demand. It would also place XLM above a zone that previously acted as resistance.
The $0.24 level is being watched as the next near-term target. It sits close to the next liquidation wall noted by traders.
A clean move above $0.25 could open space toward $0.30 to $0.32. Those levels match earlier reaction areas on the chart.
However, price is stretched in the short term. The daily RSI is near 80, which is an overbought reading.
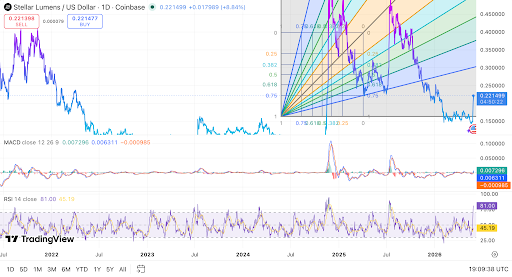
The MACD has also turned positive. Its line is above the signal line, while the histogram remains above zero.
For bulls, the key level to hold is now $0.19 to $0.20. A pullback into that area could test fresh buyer demand.
A fall below that zone would weaken the breakout structure. It could also place the $0.145 to $0.160 support area back in focus.
Digital Currency Market Dynamics:#XLM #Surges #Liquidation #Sweep
