
Ethereum trades near $2,284 as a five-year triangle projects $8,900 next cycle, with $2,400 to $2,500 resistance in focus.
Ethereum is trading near $2,284 as traders review a long-term chart pattern and short-term market levels.
A five-year ascending triangle has drawn attention because its measured move points toward the $8,900 region for the next cycle.
The setup is not confirmed yet, as ETH still trades below the $2,400 to $2,500 resistance range.
Five-Year Ascending Triangle Offers a Measured ETH Target
Ethereum’s long-term chart shows an ascending triangle pattern that has developed across nearly five years.
Traders often track this structure because it can show steady buyer demand near rising support.
The measured move method is used to estimate a possible target after a breakout. It takes the vertical height of the triangle base and projects it from the breakout level.
Based on this structure, Ethereum points toward the $8,900 region. This target is more measured than wider market calls for $25,000 or $60,000.
I’m already seeing the typical crazy numbers being thrown around as to what price $ETH is going to hit next cycle.
$25K.. $60K..
Let’s be realistic.
Right now, the easiest way to quantify the potential upside is a measured move from ascending triangle pattern it has been… pic.twitter.com/nHBhavWIXG
— Ardi (@ArdiNSC) April 30, 2026
The projection does not confirm that ETH will reach that level. Price can undershoot or overshoot the target due to liquidity, demand, and broader crypto market conditions.
The pattern also needs a confirmed breakout before traders treat the target as active. Until then, the $8,900 level remains a technical projection.
Ethereum Trades Near $2,284 as Resistance Blocks Momentum
Ethereum is trading near $2,284 on the daily chart after recovering from the $1,800 to $2,000 area. That zone acted as support after the recent decline.
The rebound shows that buyers entered near lower levels. However, ETH has not yet confirmed a stronger bullish reversal.
The $2,400 to $2,500 range remains the main resistance zone. This area has acted as an important pivot several times since 2024.
A daily close above this range could improve the short-term structure. It could also place the $2,800 level back in focus for traders.
If ETH fails to reclaim $2,400 to $2,500, price may stay in a cautious range. Traders may continue to watch support and resistance before taking stronger positions.
Read Also:
Ethereum Range Holds Firm While Momentum Stays Weak Near Key Support
MACD and RSI Show a Market Waiting for Clear Direction
Ethereum’s momentum indicators show a neutral market setup. The MACD line is near 23.1, while the signal line is near 39.2.
The histogram is around minus 16.1, which shows that bearish pressure remains present. However, the reading is not extreme.
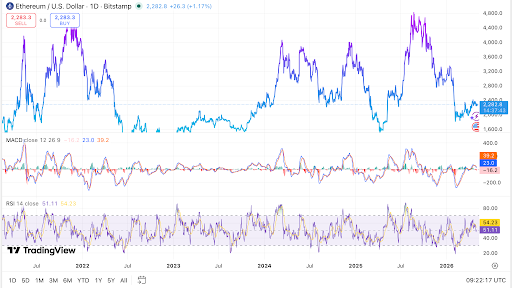
The RSI is near 51.28, with its moving average near 54.24. This places Ethereum near neutral territory and away from overbought conditions.
Immediate support sits near $2,150 and then $2,000. A clean break below $2,000 could bring the $1,800 region back into view.
On the upside, resistance remains near $2,400, $2,800, and $3,200. A move above $2,800 would show stronger recovery activity.
For now, Ethereum remains between a long-term bullish projection and short-term resistance. The next major signal may come from the $2,400 to $2,500 zone.
Digital Currency Market Dynamics:#Ethereum #Triangle #Signals #Cycle #Target