




CryptoQuant’s CEO flags an 18-month Bitcoin bear cycle running to early 2027. Here’s what key price levels and analysts say right now.
Bitcoin is flashing bearish signals across multiple timeframes. CryptoQuant CEO Ki Young Ju shared a striking forecast this week.
He warned that the current Bitcoin bear market could stretch all the way to early 2027.
The projection stems from an analysis of Bitcoin’s PnL Index. According to Ju, once profit-taking cascades begin, investor losses typically drag on for about 18 months.
Read also:
Strategy Sends 411 Bitcoin to Coinbase as Sell Odds Surge to 84%
Bitcoin Bear Cycle Timeline and the PnL Index
Ju pointed to October 2025 as the turning point. That is when the bearish trend reportedly began. Based on historical patterns, that places a potential market bottom somewhere in early 2027.
His 365-day moving average chart of the PnL Index backs this view. The chart shows sharp drops following past bull market peaks. The current trend mirrors those previous post-peak patterns closely.
Once profit-taking cascades, Bitcoin investors’ PnL typically falls for about 18 months.
Since the trend turned in Oct 2025, the bear market could last until early 2027.
The trend only changes when unrealized profits rise and realized profits fall. We’re not there yet. pic.twitter.com/fQyIRLu8vv
— Ki Young Ju (@ki_young_ju) May 29, 2026
Ju also noted that a true reversal needs a specific condition. Unrealized profits must rise while realized profits fall simultaneously. As of now, that signal has not appeared.
Key BTC Price Levels Traders Are Watching
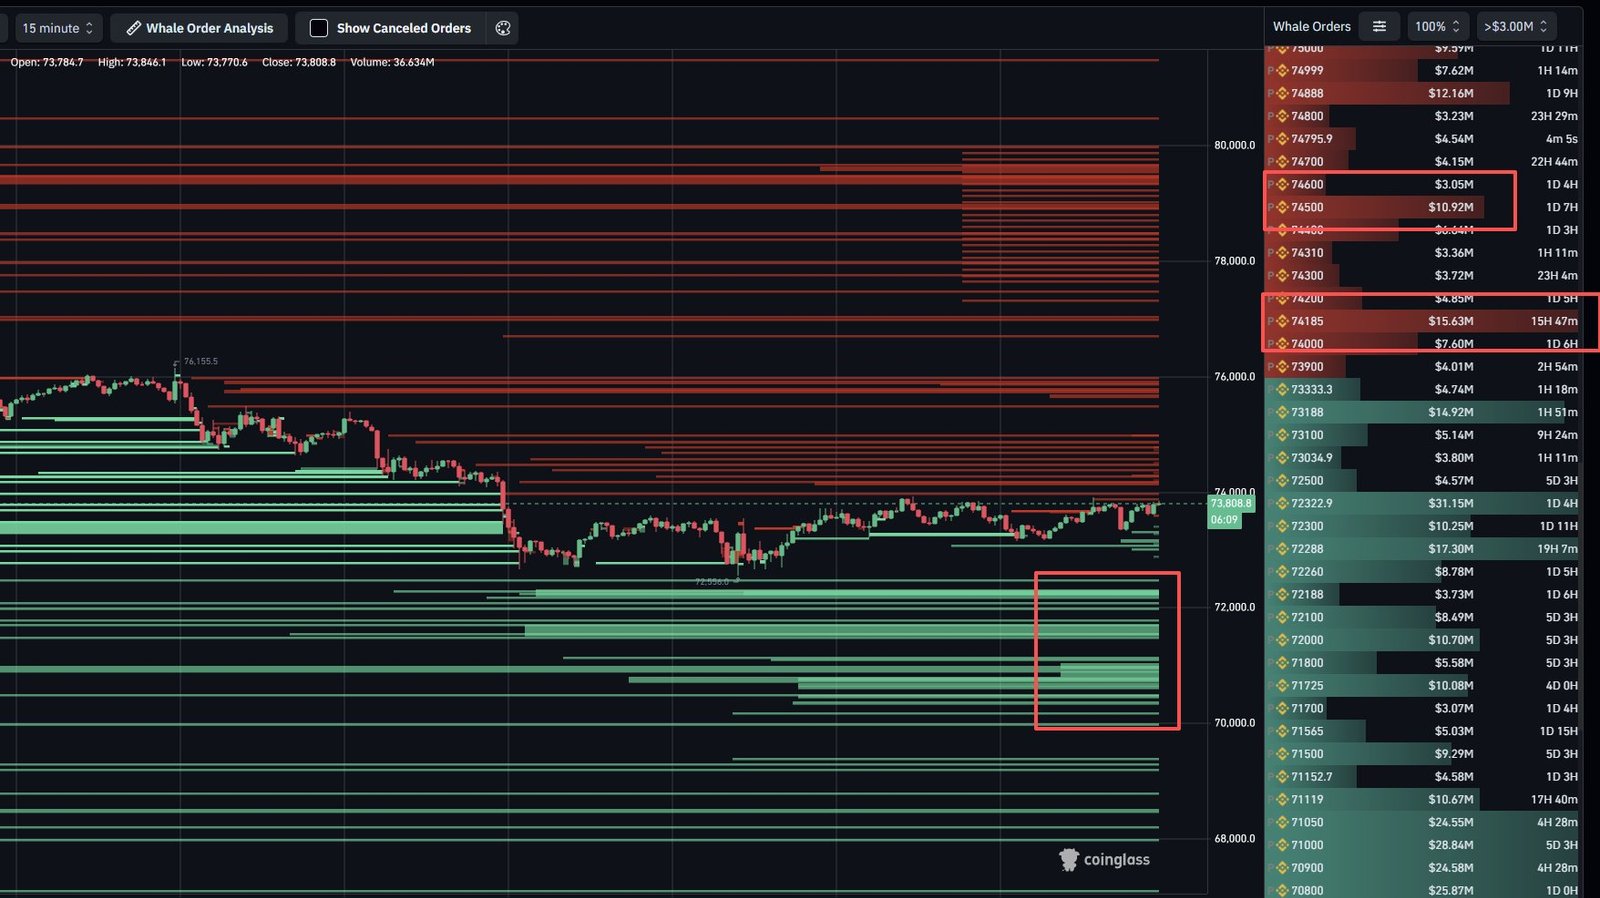
Market data platform CoinGlass shared a whale order book update for Bitcoin. It identified $74,200 and $74,500 as major resistance zones.
Large sell orders are clustered in that range, making it a critical test for buyers.
On the support side, CoinGlass flagged $73,200 and $72,300 as levels to watch. If buyers can absorb the supply above $74,500, CoinGlass noted that momentum could push toward $75,000 to $76,000.
Bitcoin’s price, per CoinGecko data, sat at $73,191 at the time of writing. That reflects a 0.18% drop in 24 hours and a 5.36% decline over seven days.
Traders Eye Structure Shifts and Short Setups
Crypto trader KillaXBT highlighted a notable structural shift on his chart.
He noted that Bitcoin broke below $79,000, triggering lower highs and lower lows since. The May monthly candle was also tracking toward a red close, he added.
KillaXBT stated he remains in a swing short position entered at $77,800. He closed 50% of that trade earlier to manage risk. The remaining position is still active.
Observing the current bitcoin:native structure, we have hit quite the key areas.
The May monthly wick hunted the previous wick high, and we can see it’s now looking to close red. As stated in previous posts, we have never had more than 3 green monthly candles in a bear market,… pic.twitter.com/5M4kL7Wsg4
— Killa (@KillaXBT) May 29, 2026
For the near term, KillaXBT is watching $74,200 closely. Failure to reclaim that level, he said, could send Bitcoin back to retest the May low near $70,500.
A clean break above $74,200, however, could open a path toward the May monthly open at $76,300.
Digital Currency Market Dynamics:#Bitcoin #Bear #Market #Analyst #Warns
