
Solana hit 10.1B Q1 transactions, $14.6B stablecoins, and two U.S. banks for USDC settlement as SOL traded near $87.
Solana is trading near $87, far below its record area near $293. Yet the network behind the token looks very different now.
New banking links, higher transaction counts, and larger stablecoin supply have changed the setup.
At the same time, the daily chart shows SOL trying to hold support after a steep pullback.
Network Activity and Stablecoin Growth Expand
Recent Solana data shows stronger on-chain use even with the token far below its peak.
The network recorded 10.1 billion transactions in the first quarter. That figure marked a record for the chain.
It also showed that user activity remained active during price weakness.
Stablecoin supply on Solana has also grown at a fast pace. The network now holds $14.6 billion in stablecoins, based on the provided figures.
That was up 167% from a year earlier. More stablecoins can support trading, payments, and other daily uses.
INSIGHT: Solana at $293 had zero US banks settling on it, fewer transactions, less stablecoin supply, and no commodity classification.
Solana at $87 has:
-> Two US banks live for USDC settlement
-> 10.1B transactions in Q1, a record
-> $14.6B in stablecoins, up 167% YoY
->…
— Tokens on Solana (@tokens) April 18, 2026
At the same time, two U.S. banks are now living for USDC settlement on Solana. That was not the case when SOL traded near $293.
The change gives Solana a new link to regulated financial use. It also adds a different layer to the network’s current profile.
Market Structure Remains Weak, But Momentum Has Improved
The daily SOL/USD chart on Coinbase shows a price near $86.14. The broader structure still looks range-bound after sharp swings since 2022.
SOL remains well below the old peak zone near $240 to $260. That keeps long-term resistance clearly in place.
Still, the current area around $80 to $90 is important support. Price has returned to that band after a steep decline.
Buyers now appear to be trying to build a base there. A stable hold in this zone could slow the recent downside pressure.
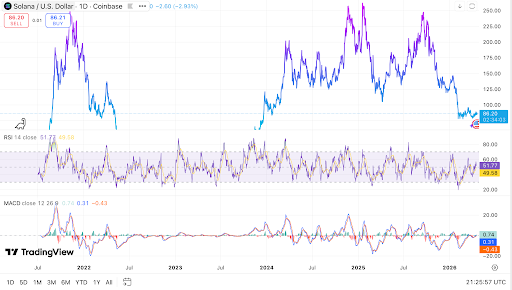
Momentum signals are mixed, though they have improved slightly. The RSI is near 51.67, which sits close to neutral.
That suggests buyers have regained some ground, but not full control. The MACD is also slightly positive and points to mild near-term recovery.
For now, $100 remains the first key level on the upside. If SOL moves above that area, traders may watch $120 to $130 next.
On the downside, a break below $80 could expose $70 to $75. That would weaken the current rebound attempt.
Read Also:
SOL Strategies Acquires Darklake Labs to Boost Solana Privacy Tech
Staking, Regulation, and Upgrades Reshape The Backdrop
The wider Solana setup has also changed in other ways. The provided figures show 425 million SOL staked, which is a two-year high.
A high staking level can reduce liquid supply in the market. It can also reflect long-term holder commitment during a weak price period.
Regulatory status has also become part of the discussion around Solana. The provided material says SOL now has SEC and CFTC commodity status.
That marks a change from the earlier market cycle. It gives traders and firms a different frame for evaluating the asset.
Meanwhile, the FTX overhang has fallen to $16 million per month. That selling pressure was once a larger concern for market participants.
A lower monthly amount may reduce one source of supply pressure. However, price has not yet fully reflected that change.
Two network upgrades are also drawing attention this quarter. Firedancer and Alpenglow are expected to hit mainnet, based on the provided material.
Those launches are being watched closely by developers and traders. Together, stronger network data and improving technical signals show a different Solana market than before.
Cryptocurrency Market Dynamics:#Solana #Fundamentals #Strengthen #SOL #Holds